What is a profit and loss report and how can I use it?

If you run a small business and you’ve ever glanced at your profit and loss (P&L) report, you may well have seen a wall of numbers and quickly moved on to the next task. Your P&L might look like a technical accounting document, but it’s actually one of the most practical tools you can use to track how your business is performing.
This guide will walk you through what your profit and loss report shows, how to read the report and what kinds of business decisions it can help you make.
What is a profit and loss report?
A profit and loss (P&L) report – also known as the ‘profit and loss account’, ‘P&L account’ or simply ‘P&L’ – is a summary of the history of your business’s trading during a given period of time. It shows your business’s income - from sales, bank interest, and other sources such as grant income - less its day-to-day running costs.
Your P&L report is one of the three core financial statements that help you understand your business’s performance and position. The other two are your balance sheet (a snapshot of what your business owns and owes) and your cashflow statement (a record of the cash coming in and out of your business).
How to read your business’s P&L report
A profit and loss report might look intimidating at first glance but it’s far easier to read once you understand its structure.
Every P&L is built around three main components.
- Revenue / income (also known as turnover): all the money earned from sales of goods or services.
- Costs (also known as expenses): everything the business spends to earn that revenue (e.g. materials, wages, rent, utilities, marketing).
- Profit (or loss): The difference - either positive or negative - between your total income and total day-to-day running costs. If this number is positive, your business has made a profit, while a negative figure indicates a loss.
Gross profit vs operating profit explained
You’ll usually see two profit figures on a P&L: gross profit and operating profit.
Gross profit is revenue minus the direct costs of producing or delivering what you sell (i.e. your costs of sales). Gross profit is most relevant to goods-based businesses, which incur costs that can be directly linked to specific sales, like raw materials and postage of finished goods.
Operating profit is revenue minus costs of sales and other administrative costs involved in running your business (e.g. rent, utilities, insurance). For service-based businesses, this figure is more relevant than gross profit, as it factors in other costs of running the business that are not direct costs of sales, which a service-based business may not have. For example, a marketing consultant may not have any costs of sales but will still have overheads like travel and office costs.
Gross profit shows goods-based businesses the immediate profit they’re making from selling their products. Operating profit shows all business owners how profitable their business is overall, once they factor in the total general costs of running it day to day.
What business decisions can my P&L help me make?
Once you know how to read your profit and loss account, it becomes a valuable tool for your business. Here are three examples of the decisions it can help you make.
Can I afford to invest in growth?
Your P&L is a record of past performance but it can also help signal whether your business may be in a position to invest in future growth. By reviewing your income, costs, and profits over time, you can see whether there’s financial room to take on new opportunities… or whether it’s better to hold off for now.
If your P&L shows consistent and healthy profits, especially if they are growing year-on-year, this may be a sign that your business can support investment in growth. For example, you might consider:
- hiring additional team members to take on more clients or increase capacity.
- upgrading equipment or technology to improve efficiency and productivity.
- expanding premises or stock levels to meet higher demand.
However, if your profits are slim, inconsistent, or heavily impacted by seasonal fluctuations, it may be wiser to focus on improving your margins first. This means increasing the difference between what you earn from each sale and what it costs you to deliver it. Strategies for improving your margins could include increasing sales, reassessing your prices, tightening cost control, or improving cashflow.
Reviewing your P&L in this way helps you make informed, confident decisions about when and how to grow, rather than relying on instinct alone.
Do I need to adjust my pricing?
Your P&L can help you spot when the balance between what you earn and what you spend is shifting, which may indicate that it’s time to review your pricing. If your costs are increasing faster than your revenue, it can indicate that your current pricing isn’t keeping pace with costs.
For example, a small cafe might notice that overall income has stayed the same over the last two years, while rent, utilities, and ingredient costs have increased. Even without seeing individual prices for different meals or drinks on the P&L, this trend shows that profit margins are shrinking.
Monitoring your P&L over time allows you to spot these patterns early. From there, you can decide whether to review pricing, look to reduce certain costs, or both, with a view to protecting profitability before it becomes a bigger problem.
How can my business become more cost efficient?
Your P&L report provides a clear overview of your day-to-day running costs for a given period of time. By reviewing these categories over time, you can identify patterns, spot unnecessary spending, and take steps to make your business more cost efficient.
For example, you might notice:
- travel or fuel costs creeping up due to frequent client visits, or longer than expected delivery routes
- overlapping or unused software subscriptions that you’re paying for but rarely use
- utility or office expenses that could be reduced by negotiating contracts or switching suppliers
Even small adjustments, when added together, can have a significant impact on your bottom line. Regularly checking your P&L allows you to make these improvements proactively rather than reacting to excess costs after they occur.
By using your P&L in this way, you can make informed decisions about where to cut costs, maintain profitability, and free up resources for growth or other strategic priorities.
Where can I find my business’s P&L report?
If you use accounting software like FreeAgent, your profit and loss report is just a few clicks away. The software automatically updates your financial data as you record invoices, expenses and payments. It’s the simplest, most reliable way for you or your accountant to get an accurate P&L report at any point in time.
If you don’t use accounting software but work with an accountant, they can prepare the report using your records, usually at the end of the accounting year.
Not using accounting software or working with an accountant? You could try creating your own P&L in a spreadsheet, although this approach is a lot more work and you’ll need to check your numbers extremely carefully.
FreeAgent’s Profit and Loss report
With FreeAgent’s Management Reports you have instant access to your business’s financial data and the insight you need to plan ahead with confidence.
Using the data you enter throughout the year, FreeAgent builds the following reports in real time:
- your Profit and Loss report
- your Balance Sheet report
- your Aged Debtors report
- your Aged Creditors report
FreeAgent handles all the double-entry bookkeeping associated with transactions like creating bills, invoices and out-of-pocket expenses, and explaining bank transactions. This means your FreeAgent Profit and Loss report will always be up to date, according to the latest data you have entered to your account.

With the Comparative profit and loss view, you can compare two different quarterly or annual reports side-by-side or view a custom date range. You can see the difference between two time periods as either a financial value or a percentage.

If you want to share your P&L report via email, save it to your device, or print a copy, you can export the report as either a CSV or PDF file.
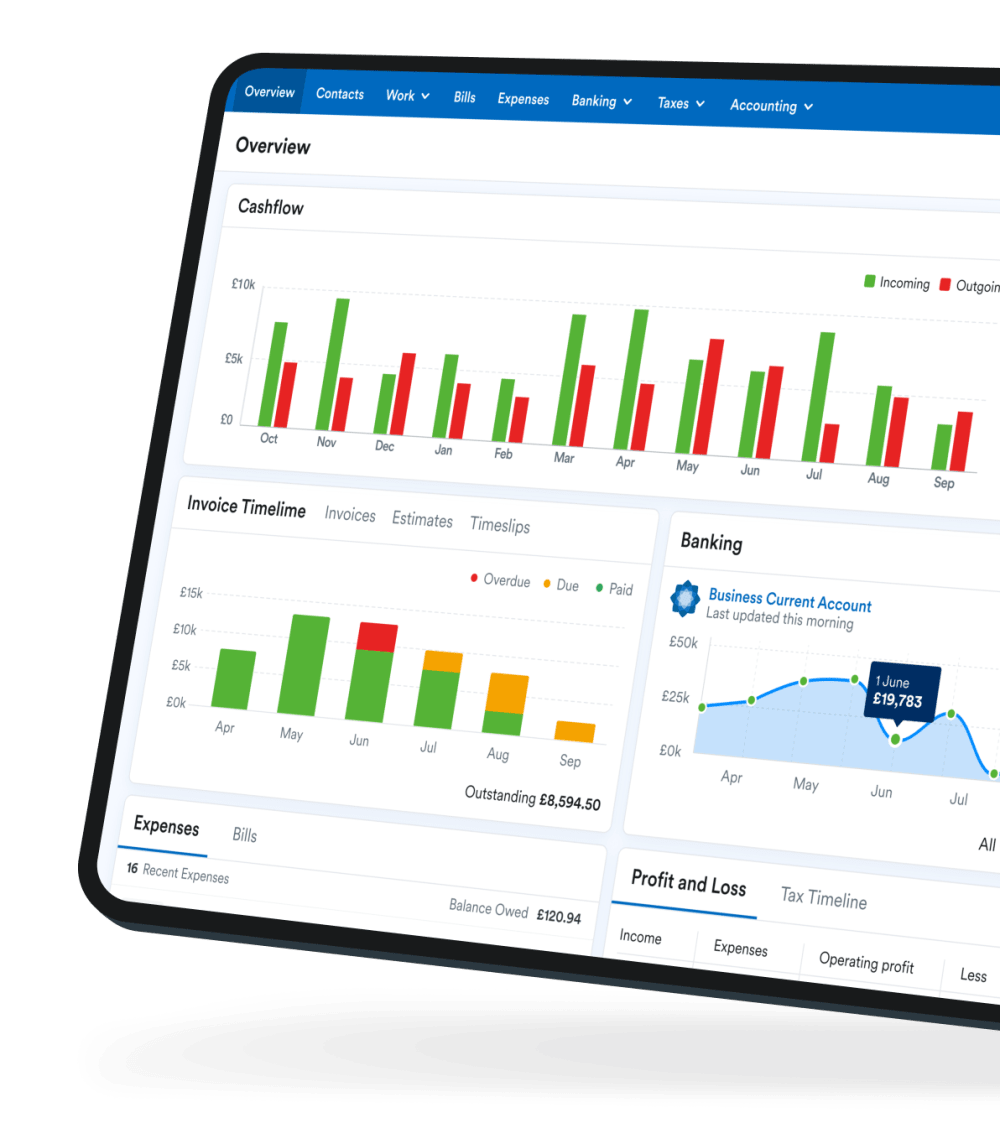
You’ll find a high-level summary of your P&L for the current year to date so far on your FreeAgent Overview screen.

You can learn more about FreeAgent’s Profit and Loss report in our Knowledge Base article.