New to the Performance Benchmarking report: similar businesses

Roan Lavery
CEO, Co-founder

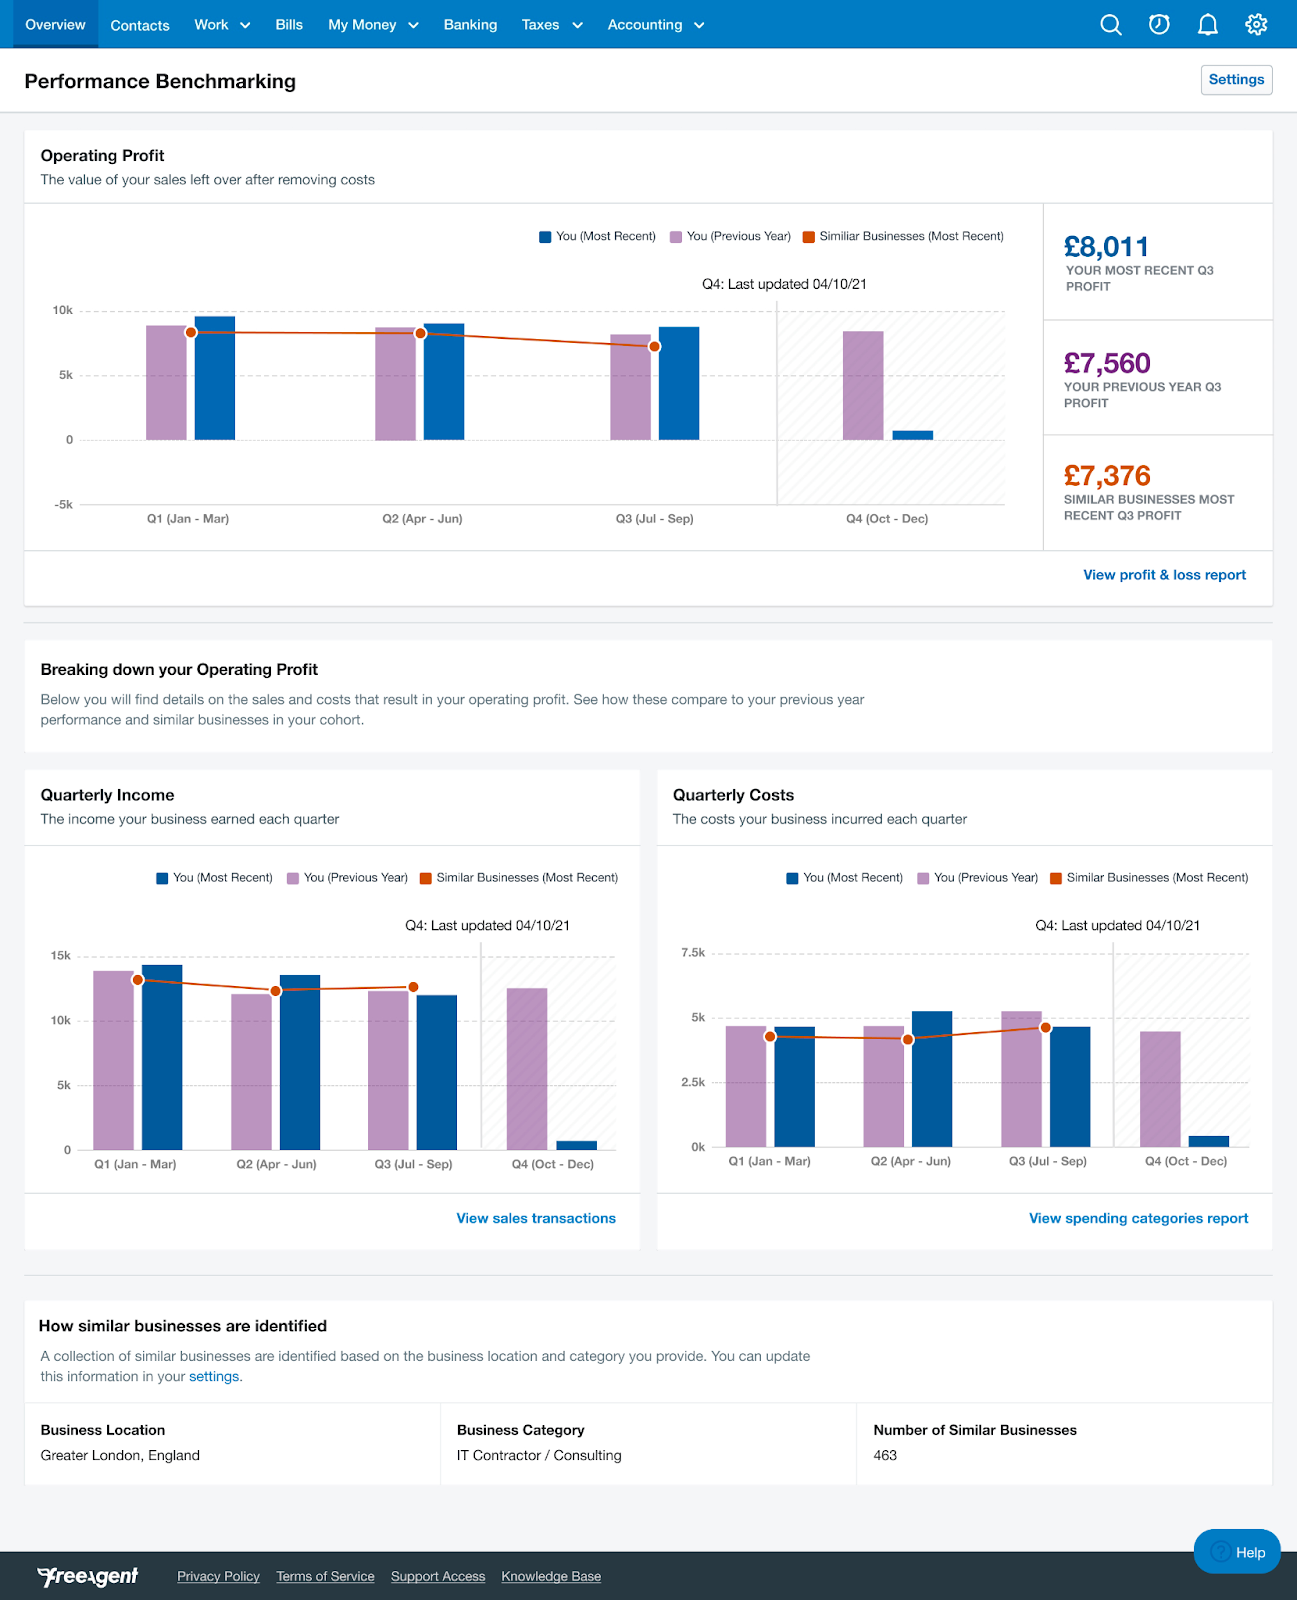
You might have spotted that we recently launched an exciting new feature in FreeAgent, the Performance Benchmarking report. If you’ve been using FreeAgent for at least a year, this report helps you get more insight into how your business is performing by showing your quarterly operating profit broken down into income and costs, with a year-on-year comparison.
Well, we’ve just taken this report to the next level by releasing a juicy new insight: similar businesses.
You can now compare your performance with similar businesses
First things first, you need to opt in to use this feature. If you didn’t do this when we reached out to you in February, you can opt in now by following the steps in this Knowledge Base article.
If you choose to anonymously share your business category and region, you’ll be able to see how your business’s operating profit, income and costs compare with businesses in the same industry and region. So if you run a pet shop in Durham, for example, your similar businesses would be ‘Vet & Pet Care in North East England’ and you could compare how you were doing against this average.
The privacy and the security of your data is of the utmost importance to us. Opting in to the similar business comparison is completely optional and any shared data will remain anonymous and unidentifiable. If you opt in, you’ll start to see similar business insights as soon as enough other businesses like yours have opted in. Some users will see similar business data right away but if you operate in a more ‘niche’ industry or location, you might have to wait a little longer to see your comparison.